Visualization and Analysis of LiDAR Big Data using Python (MIT Hackathon)
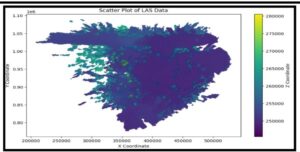

Project : This project focused on visualizing and analyzing Big Data stored in .LAS datasets collected by scanning the Walker Hill site in the Arizona forest, provided by Ironwood Forestry LLC. Each dataset contained millions of LiDAR points, which are typically processed using commercial software such as LiDAR360 or Vision LiDAR. Instead of relying on these tools, I aimed to develop a lightweight and efficient custom code that could organize and visualize such large datasets quickly and effectively.
Role : My role was to design and implement the data processing and visualization workflow, ensuring that the large-scale LiDAR data could be handled efficiently without expensive software dependencies.
Action : I developed code that was capable of reading .LAS files containing millions of points, structuring the raw LiDAR data into tabular formats for analysis, and converting the datasets into clear graphical visualizations for interpretation. The approach focused on efficiency, reducing processing time while ensuring accuracy in data representation. I developed entire code on google colab. The prime motivation for using it was : 1) it eliminated user needs of high end laptops or PCs to run high end softwares, 2) Easily accessibility by everyone since it is cloud based.